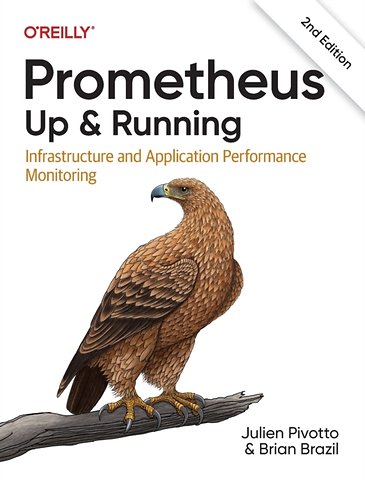
Prometheus - Up & Running
Infrastructure and Application Performance Monitoring
Paperback Engels 2023 2e druk 9781098131142Samenvatting
Get up to speed with Prometheus, the metrics-based monitoring system used in production by tens of thousands of organizations. This updated second edition provides site reliability engineers, Kubernetes administrators, and software developers with a hands-on introduction to the most important aspects of Prometheus, including dashboarding and alerting, direct code instrumentation, and metric collection from third-party systems with exporters.
Prometheus server maintainer Julien Pivotto and core developer Brian Brazil demonstrate how you can use Prometheus for application and infrastructure monitoring. This book guides you through Prometheus setup, the Node Exporter, and the Alertmanager, and then shows you how to use these tools for application and infrastructure monitoring. You'll understand why this open source system has continued to gain popularity in recent years.
You will:
- Know where and how much instrumentation to apply to your application code
- Monitor your infrastructure with Node Exporter and use new collectors for network system pressure metrics
- Get an introduction to Grafana, a popular tool for building dashboards
- Use service discovery and the new HTTP SD monitoring system to provide different views of your machines and services
- Use Prometheus with Kubernetes and examine exporters you can use with containers
- Discover Prom's new improvements and features, including trigonometry functions
- Learn how Prometheus supports important security features including TLS and basic authentication
Specificaties
Lezersrecensies
Inhoudsopgave
Expanding the Known
The Evolution of Prometheus
Conventions Used in This Book
Using Code Examples
O’Reilly Online Learning
How to Contact Us
Acknowledgments
I. Introduction
1. What Is Prometheus?
What Is Monitoring?
A Brief and Incomplete History of Monitoring
Categories of Monitoring
Prometheus Architecture
Client Libraries
Exporters
Service Discovery
Scraping
Storage
Dashboards
Recording Rules and Alerts
Alert Management
Long-Term Storage
What Prometheus Is Not
2. Getting Started with Prometheus
Running Prometheus
Using the Expression Browser
Running the Node Exporter
Alerting
II. Application Monitoring
3. Instrumentation
A Simple Program
The Counter
Counting Exceptions
Counting Size
The Gauge
Using Gauges
Callbacks
The Summary
The Histogram
Buckets
Unit Testing Instrumentation
Approaching Instrumentation
What Should I Instrument?
How Much Should I Instrument?
What Should I Name My Metrics?
4. Exposition
Python
WSGI
Twisted
Multiprocess with Gunicorn
Go
Java
HTTPServer
Servlet
Pushgateway
Parsers
Text Exposition Format
Metric Types
Labels
Escaping
Timestamps
check metrics
OpenMetrics
Metric Types
Labels
Timestamps
5. Labels
What Are Labels?
Instrumentation and Target Labels
Instrumentation
Metric
Multiple Labels
Child
Aggregating
Label Patterns
Enum
Info
When to Use Labels
Cardinality
6. Dashboarding with Grafana
Installation
Data Source
Dashboards and Panels
Avoiding the Wall of Graphs
Time Series Panel
Time Controls
Stat Panel
Table Panel
State Timeline Panel
Template Variables
III. Infrastructure Monitoring
7. Node Exporter
CPU Collector
Filesystem Collector
Diskstats Collector
Netdev Collector
Meminfo Collector
Hwmon Collector
Stat Collector
Uname Collector
OS Collector
Loadavg Collector
Pressure Collector
Textfile Collector
Using the Textfile Collector
Timestamps
8. Service Discovery
Service Discovery Mechanisms
Static
File
HTTP
Consul
EC2
Relabeling
Choosing What to Scrape
Target Labels
How to Scrape
metric_relabel_configs
Label Clashes and honor_labels
9. Containers and Kubernetes
cAdvisor
CPU
Memory
Labels
Kubernetes
Running in Kubernetes
Service Discovery
kube-state-metrics
Alternative Deployments
10. Common Exporters
Consul
MySQLd
Grok Exporter
Blackbox
ICMP
TCP
HTTP
DNS
Prometheus Configuration
11. Working with Other Monitoring Systems
Other Monitoring Systems
InfluxDB
StatsD
12. Writing Exporters
Consul Telemetry
Custom Collectors
Labels
Guidelines
IV. PromQL
13. Introduction to PromQL
Aggregation Basics
Gauge
Counter
Summary
Histogram
Selectors
Matchers
Instant Vector
Range Vector
Subqueries
Offset
At Modifier
HTTP API
query
query_range
14. Aggregation Operators
Grouping
without
by
Operators
sum
count
avg
group
stddev and stdvar
min and max
topk and bottomk
quantile
count_values
15. Binary Operators
Working with Scalars
Arithmetic Operators
Trigonometric Operator
Comparison Operators
Vector Matching
One-to-One
Many-to-One and group_left
Many-to-Many and Logical Operators
Operator Precedence
16. Functions
Changing Type
vector
scalar
Math
abs
ln, log2, and log10
exp
sqrt
ceil and floor
round
clamp, clamp_max, and clamp_min
sgn
Trigonometric Functions
Time and Date
time
minute, hour, day_of_week, day_of_month, day_of_year, days_in_month, month, and year
timestamp
Labels
label_replace
label_join
Missing Series, absent, and absent_over_time
Sorting with sort and sort_desc
Histograms with histogram_quantile
Counters
rate
increase
irate
resets
Changing Gauges
changes
deriv
predict_linear
delta
idelta
holt_winters
Aggregation Over Time
17. Recording Rules
Using Recording Rules
When to Use Recording Rules
Reducing Cardinality
Composing Range Vector Functions
Rules for APIs
How Not to Use Rules
Naming of Recording Rules
V. Alerting
18. Alerting
Alerting Rules
for
Alert Labels
Annotations and Templates
What Are Good Alerts?
Configuring Alertmanagers in Prometheus
External Labels
19. Alertmanager
Notification Pipeline
Configuration File
Routing Tree
Receivers
Inhibitions
Alertmanager Web Interface
VI. Deployment
20. Server-Side Security
Security Features Provided by Prometheus
Enabling TLS
Advanced TLS Options
Enabling Basic Authentication
21. Putting It All Together
Planning a Rollout
Growing Prometheus
Going Global with Federation
Long-Term Storage
Running Prometheus
Hardware
Configuration Management
Networks and Authentication
Planning for Failure
Alertmanager Clustering
Meta- and Cross-Monitoring
Managing Performance
Detecting a Problem
Finding Expensive Metrics and Targets
Reducing Load
Horizontal Sharding
Managing Change
Getting Help
Index
About the Authors


Rubrieken
- advisering
- algemeen management
- coaching en trainen
- communicatie en media
- economie
- financieel management
- inkoop en logistiek
- internet en social media
- it-management / ict
- juridisch
- leiderschap
- marketing
- mens en maatschappij
- non-profit
- ondernemen
- organisatiekunde
- personal finance
- personeelsmanagement
- persoonlijke effectiviteit
- projectmanagement
- psychologie
- reclame en verkoop
- strategisch management
- verandermanagement
- werk en loopbaan