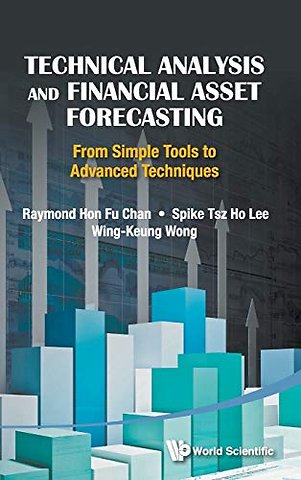
TECHNICAL ANALYSIS & FINANCIAL ASSET FORECASTING
Gebonden EN 2014 9789814436243Samenvatting
Technical analysis is defined as the tracking and prediction of asset price movements using charts and graphs in combination with various mathematical and statistical methods. More precisely, it is the quantitative criteria used in predicting the relative strength of buying and selling forces within a market to determine what to buy, what to sell, and when to execute trades.
This book introduces simple technical analysis tools like moving averages and Bollinger bands, and also advanced techniques such as wavelets and empirical mode decomposition. It first discusses some traditional tools in technical analysis, such as trend, trend Line, trend channel, Gann's Theory, moving averages, and Bollinger bands. It then introduces a recent indicator developed for stock market and two recent techniques used in the technical analysis field: wavelets and the empirical mode decomposition in financial time series. The book also discusses the theory to test the performance of the indicators and introduces the MATLAB Financial Toolbox, some of the functions/codes of which are used in our numerical experiments.
Specificaties
Lezersrecensies




Rubrieken
- advisering
- algemeen management
- coaching en trainen
- communicatie en media
- economie
- financieel management
- inkoop en logistiek
- internet en social media
- it-management / ict
- juridisch
- leiderschap
- marketing
- mens en maatschappij
- non-profit
- ondernemen
- organisatiekunde
- personal finance
- personeelsmanagement
- persoonlijke effectiviteit
- projectmanagement
- psychologie
- reclame en verkoop
- strategisch management
- verandermanagement
- werk en loopbaan