,

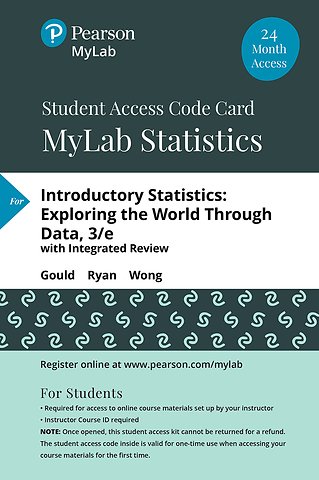
MyLab Statistics with Pearson eText Access Code (24 Months) for Introductory Statistics

Exploring the World Through Data

Onbekend Engels 2019 9780135190234
€ 172,54
Levertijd ongeveer 9 werkdagen
Gratis verzonden

Samenvatting

MyLab Statistics Standalone Access Card to accompany Gould/Ryan/Wong, Introductory Statistics: Exploring the World Through Data, 3e

This item is an access card for MyLab™ Statistics. This physical access card includes an access code for your MyLab Statistics course. In order to access the online course you will also need a Course ID, provided by your instructor.

This title-specific access card provides access to the Gould/Ryan/Wong, Introductory Statistics: Exploring the World Through Data, 3e accompanying MyLab course ONLY.

0135190231 / 9780135190234 MYLAB STATISTICS WITH PEARSON ETEXT -- STANDALONE ACCESS CARD -- FOR INTRODUCTORY STATISTICS: EXPLORING THE WORLD THROUGH DATA, 3/e 

MyLab Statistics is the world’s leading online tutorial, and assessment program designed to help you learn and succeed in your statistics course. MyLab Statistics online courses are created to accompany one of Pearson’s  best-selling math textbooks. Every MyLab Statistics course includes a complete, interactive eText. Learn more about MyLab Statistics.

ALERT:

Before you purchase, check with your instructor or review your course syllabus to ensure that you select the correct ISBN.

Used or rental books

If you rent or purchase a used book with an access code, the access code may have been redeemed previously and you may have to purchase a new access code.


Access codes

Access codes that are purchased from sellers other than Pearson carry a higher risk of being either the wrong ISBN or a previously redeemed code. Check with the seller prior to purchase.

Specificaties

ISBN13:9780135190234
Taal:Engels
Bindwijze:onbekend

Lezersrecensies

Wees de eerste die een lezersrecensie schrijft!

Inhoudsopgave

<div class="c-section-headers-number-list_container"> <h3>1. Introduction to Data</h3> <ul> <li>1.1 What Are Data?</li> <li>1.2 Classifying and Storing Data</li> <li>1.3 Investigating Data</li> <li>1.4 Organizing Categorical Data</li> <li>1.5 Collecting Data to Understand Causality</li> </ul> <h3>2. Picturing Variation with Graphs</h3> <ul> <li>2.1 Visualizing Variation in Numerical Data</li> <li>2.2 Summarizing Important Features of a Numerical Distribution</li> <li>2.3 Visualizing Variation in Categorical Variables</li> <li>2.4 Summarizing Categorical Distributions</li> <li>2.5 Interpreting Graphs</li> </ul> <h3>3. Numerical Summaries of Center and Variation</h3> <ul> <li>3.1 Summaries for Symmetric Distributions</li> <li>3.2 What's Unusual? The Empirical Rule and z-Scores</li> <li>3.3 Summaries for Skewed Distributions</li> <li>3.4 Comparing Measures of Center</li> <li>3.5 Using Boxplots for Displaying Summaries&lt;</li> </ul> <h3>4. Regression Analysis: Exploring Associations between Variables</h3> <ul> <li>4.1 Visualizing Variability with a Scatterplot</li> <li>4.2 Measuring Strength of Association with Correlation</li> <li>4.3 Modeling Linear Trends</li> <li>4.4 Evaluating the Linear Model</li> </ul> <h3>5. Modeling Variation with Probability</h3> <ul> <li>5.1 What Is Randomness?</li> <li>5.2 Finding Theoretical Probabilities</li> <li>5.3 Associations in Categorical Variables</li> <li>5.4 Finding Empirical Probabilities</li> </ul> <h3>6. Modeling Rando Events: The Normal and Binomial Models</h3> <ul> <li>6.1 Probability Distributions Are Models of Random Experiments</li> <li>6.2 The Normal Model</li> <li>6.3 The Binomial Model (Optional)</li> </ul> <h3>7. Survey Sampling and Inference</h3> <ul> <li>7.1 Learning about the World through Surveys</li> <li>7.2 Measuring the Quality of a Survey</li> <li>7.3 The Central Limit Theorem for Sample Proportions</li> <li>7.4 Estimating the Population Proportion with Confidence Intervals</li> <li>7.5 Comparing Two Population Proportions with Confidence</li> </ul> <h3>8. Hypothesis Testing for Population Proportions</h3> <ul> <li>8.1 The Essential Ingredients of Hypothesis Testing</li> <li>8.2 Hypothesis Testing in Four Steps</li> <li>8.3 Hypothesis Tests in Detail</li> <li>8.4 Comparing Proportions from Two Populations</li> </ul> <h3>9. Inferring Population Means</h3> <ul> <li>9.1 Sample Means of Rando Samples</li> <li>9.2 The Central Limit Theorem for Sample Means</li> <li>9.3 Answering Questions about the Mean of a Population</li> <li>9.4 Hypothesis Testing for Means</li> <li>9.5 Comparing Two Population Means</li> <li>9.6 Overview of Analyzing Means</li> </ul> <h3>10. Associations between Categorical Variables</h3> <ul> <li>10.1 The Basic Ingredients for Testing with Categorical Variables</li> <li>10.2 The Chi-Square Test for Goodness of Fit</li> <li>10.3 Chi-Square Tests for Associations between Categorical Variables</li> <li>10.4 Hypothesis Tests When Sample Sizes Are Small</li> </ul> <h3>11. Multiple Comparisons and Analysis of Variance</h3> <ul> <li>11.1 Multiple Comparisons</li> <li>11.2 The Analysis of Variance</li> <li>11.3 The ANOVA Test</li> <li>11.4 Post-Hoc Procedures</li> </ul> <h3>12. Experimental Design: Controlling Variation</h3> <ul> <li>12.1 Variation Out of Control</li> <li>12.2 Controlling Variation in Surveys</li> <li>12.3 Reading Research Papers</li> </ul> <h3>13. Inference without Normality</h3> <ul> <li>13.1 Transforming Data</li> <li>13.2 The Sign Test for Paired Data</li> <li>13.3 Mann-Whitney Test for Two Independent Groups</li> <li>13.4 Randomization Tests</li> </ul> <h3>14. Inference for Regression</h3> <ul> <li>14.1 The Linear Regression Model</li> <li>14.2 Using the Linear Model</li> <li>14.3 Predicting Values and Estimating Means</li> </ul> </div>

Managementboek Top 100

€ 172,54
Levertijd ongeveer 9 werkdagen
Gratis verzonden

Rubrieken

    Personen

      Trefwoorden

        MyLab Statistics with Pearson eText Access Code (24 Months) for Introductory Statistics