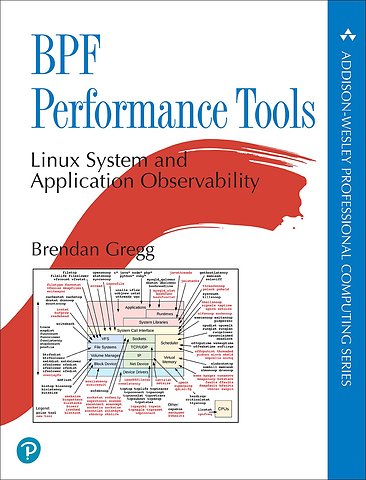
BPF Performance Tools

Linux System and Application Observability

Paperback Engels 2020 1e druk 9780136554820
€ 74,61
Levertijd ± 3 werkdagen
Gratis verzonden

Samenvatting

Use BPF Tools to Optimize Performance, Fix Problems, and See Inside Running Systems

BPF-based performance tools give you unprecedented visibility into systems and applications, so you can optimize performance, troubleshoot code, strengthen security, and reduce costs. 'BPF Performance Tools: Linux System and Application Observability' is the definitive guide to using these tools for observability.

Pioneering BPF expert Brendan Gregg presents more than 150 ready-to-run analysis and debugging tools, expert guidance on applying them, and step-by-step tutorials on developing your own. You’ll learn how to analyze CPUs, memory, disks, file systems, networking, languages, applications, containers, hypervisors, security, and the kernel. Gregg guides you from basic to advanced tools, helping you generate deeper, more useful technical insights for improving virtually any Linux system or application.

- Learn essential tracing concepts and both core BPF front-ends: BCC and bpftrace
- Master 150+ powerful BPF tools, including dozens created just for this book, and available for download
- Discover practical strategies, tips, and tricks for more effective analysis
- Analyze compiled, JIT-compiled, and interpreted code in multiple languages: C, Java, bash shell, and more
- Generate metrics, stack traces, and custom latency histograms
- Use complementary tools when they offer quick, easy wins
- Explore advanced tools built on BPF: PCP and Grafana for remote monitoring, eBPF Exporter, and kubectl-trace for tracing Kubernetes
- Foreword by Alexei Starovoitov, creator of the new BPF

BPF Performance Tools will be an indispensable resource for all administrators, developers, support staff, and other IT professionals working with any recent Linux distribution in any enterprise or cloud environment

Specificaties

ISBN13:9780136554820
Taal:Engels
Bindwijze:paperback
Aantal pagina's:880
Druk:1
Verschijningsdatum:3-3-2020
Hoofdrubriek:IT-management / ICT

Lezersrecensies

Wees de eerste die een lezersrecensie schrijft!

Over Brendan Gregg

Brendan Gregg is a senior performance engineer at Netflix and a major contributor to BPF (eBPF), leading its use for observability. He is the author of multiple technical books and received the USENIX LISA Award for Outstanding Achievement in System Administration. He has also been a kernel engineer and performance lead, and was program co-chair for the USENIX LISA 2018 conference. Gregg has spent 15 years using BPF and earlier tracers in production environments, has published widely about his work, and has taught performance analysis worldwide. He was primary author of DTrace: Dynamic Tracing in Oracle Solaris, Mac OS X, and FreeBSD, and author of the best-selling Systems Performance: Enterprise and the Cloud. For five years, he has been focused on BPF tracing. He has helped to develop and maintain the main BPF front-ends, bcc and bpftrace, for which he created reference guides, tutorials, and 70+ new BPF performance analysis tools, plus another 80 for his book BPF Performance Tools.

Andere boeken door Brendan Gregg

Inhoudsopgave

Part I: Technologies
Chapter 1 Introduction 1
1.1 What Are BPF and eBPF? 1
1.2 What Are Tracing, Snooping, Sampling, Profiling, and Observability? 2
1.3 What Are BCC, bpftrace, and IO Visor? 3
1.4 A First Look at BCC: Quick Wins 4
1.5 BPF Tracing Visibility 6
1.6 Dynamic Instrumentation: kprobes and uprobes 8
1.7 Static Instrumentation: Tracepoints and USDT 9
1.8 A First Look at bpftrace: Tracing open() 10
1.9 Back to BCC: Tracing open() 12
1.10 Summary 14

Chapter 2 Technology Background 15
2.1 BPF Illustrated 15
2.2 BPF 16
2.3 Extended BPF (eBPF) 17
2.3.1 Why Performance Tools Need BPF 19
2.3.2 BPF Versus Kernel Modules 21
2.3.3 Writing BPF Programs 22
2.3.4 Viewing BPF Instructions: bpftool 23
2.3.5 Viewing BPF Instructions: bpftrace 30
2.3.6 BPF API 31
2.3.7 BPF Concurrency Controls 35
2.3.8 BPF sysfs Interface 36
2.3.9 BPF Type Format (BTF) 37
2.3.10 BPF CO-RE 37
2.3.11 BPF Limitations 38
2.3.12 BPF Additional Reading 38
2.4 Stack Trace Walking 39
2.4.1 Frame Pointer—Based Stacks 39
2.4.2 debuginfo 40
2.4.3 Last Branch Record (LBR) 40
2.4.4 ORC 40
2.4.5 Symbols 41
2.4.6 More Reading 41
2.5 Flame Graphs 41
2.5.1 Stack Trace 41
2.5.2 Profiling Stack Traces 41
2.5.3 Flame Graph 42
2.5.4 Flame Graph Features 44
2.5.5 Variations 44
2.6 Event Sources 45
2.7 kprobes 46
2.7.1 How kprobes Work 46
2.7.2 kprobes Interfaces 47
2.7.3 BPF and kprobes 48
2.7.4 kprobes Additional Reading 49
2.8 uprobes 49
2.8.1 How uprobes Work 49
2.8.2 Uprobes Interfaces 51
2.8.3 BPF and uprobes 51
2.8.4 uprobes Overhead and Future Work 52
2.8.5 uprobes Additional Reading 52
2.9 Tracepoints 53
2.9.1 Adding Tracepoint Instrumentation 53
2.9.2 How Tracepoints Work 55
2.9.3 Tracepoint Interfaces 56
2.9.4 Tracepoints and BPF 56
2.9.5 BPF Raw Tracepoints 57
Afgekapt op 60 regels

Managementboek Top 100

€ 74,61
Levertijd ongeveer 3 werkdagen
Gratis verzonden

Rubrieken

Producten

    Auteurs

      Trefwoorden

        Artikelen

          BPF Performance Tools