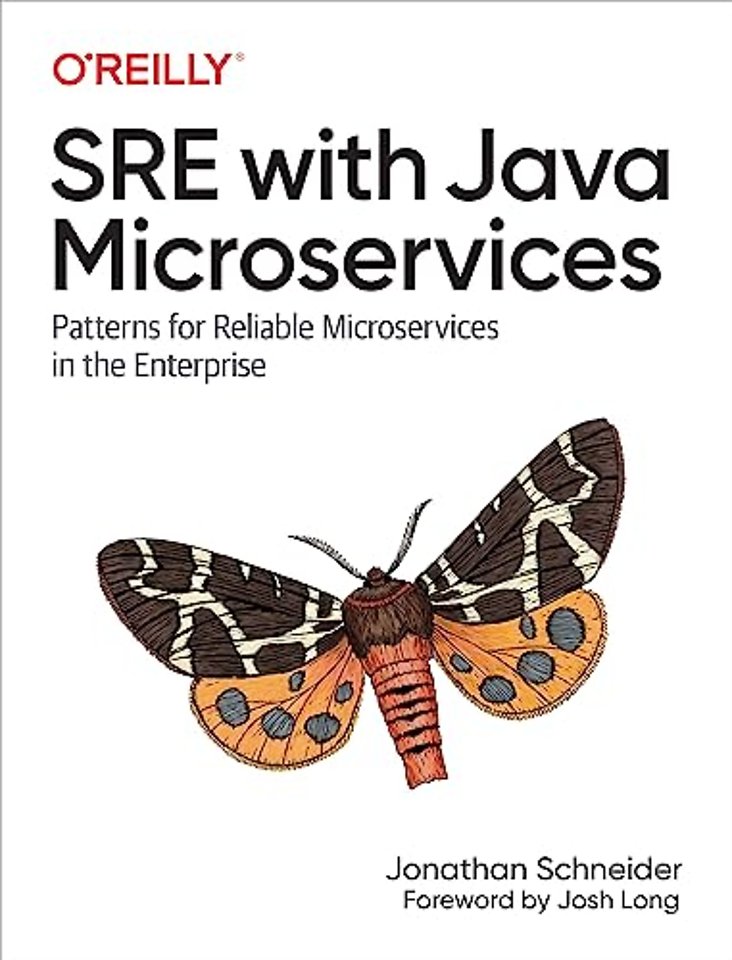
SRE with Java Microservices
Patterns for Reliable Microservices and Serverless Applications in the Enterprise
Paperback Engels 2020 1e druk 9781492073925Samenvatting
In a microservices architecture, the whole is indeed greater than the sum of its parts. But in practice, individual microservices can inadvertently impact others and alter the end user experience. Effective microservices architectures require standardization on an organizational level with the help of a platform engineering team.
This practical book provides a series of progressive steps that platform engineers can apply technically and organizationally to achieve highly resilient Java applications. Author Jonathan Schneider covers many effective SRE practices from companies leading the way in microservices adoption. You’ll examine several patterns discovered through much trial and error in recent years, complete with Java code examples.
Chapters are organized according to specific patterns, including:
- Application metrics: Monitoring for availability with Micrometer
- Debugging with observability: Logging and distributed tracing; failure injection testing
- Charting and alerting: Building effective charts; KPIs for Java microservices
- Safe multicloud delivery: Spinnaker, deployment strategies, and automated canary analysis
- Source code observability: Dependency management, API utilization, and end-to-end asset inventory
- Traffic management: Concurrency of systems; platform, gateway, and client-side load balancing
Specificaties
Lezersrecensies
Inhoudsopgave
Preface
My Journey
Conventions Used in This Book
O’Reilly Online Learning
How to Contact Us
Acknowledgments
1. The Application Platform
Platform Engineering Culture
Monitoring
Monitoring for Availability
Monitoring as a Debugging Tool
Learning to Expect Failure
Effective Monitoring Builds Trust
Delivery
Traffic Management
Capabilities Not Covered
Testing Automation
Chaos Engineering and Continuous Verification
Configuration as Code
Encapsulating Capabilities
Service Mesh
Summary
2. Application Metrics
Black Box Versus White Box Monitoring
Dimensional Metrics
Hierarchical Metrics
Micrometer Meter Registries
Creating Meters
Naming Metrics
Common Tags
Classes of Meters
Gauges
Counters
Timers
“Count” Means “Throughput”
“Count” and “Sum” Together Mean “Aggregable Average”
Maximum Is a Decaying Signal That Isn’t Aligned to the Push Interval
The Sum of Sum Over an Interval
The Base Unit of Time
Using Timers
Common Features of Latency Distributions
Percentiles/Quantiles
Histograms
Service Level Objective Boundaries
Distribution Summaries
Long Task Timers
Choosing the Right Meter Type
Controlling Cost
Coordinated Omission
Load Testing
Meter Filters
Deny/Accept Meters
Transforming Metrics
Configuring Distribution Statistics
Separating Platform and Application Metrics
Partitioning Metrics by Monitoring System
Meter Binders
Summary
3. Debugging with Observability
The Three Pillars of Observability…or Is It Two?
Logs
Distributed Tracing
Metrics
Which Telemetry Is Appropriate?
Components of a Distributed Trace
Types of Distributed Tracing Instrumentation
Manual Tracing
Agent Tracing
Framework Tracing
Service Mesh Tracing
Blended Tracing
Sampling
No Sampling
Rate-Limiting Samplers
Probabilistic Samplers
Boundary Sampling
Impact of Sampling on Anomaly Detection
Distributed Tracing and Monoliths
Correlation of Telemetry
Metric to Trace Correlation
Using Trace Context for Failure Injection and Experimentation
Summary
4. Charting and Alerting
Differences in Monitoring Systems
Effective Visualizations of Service Level Indicators
Styles for Line Width and Shading
Errors Versus Successes
“Top k” Visualizations
Prometheus Rate Interval Selection
Gauges
Counters
Timers
When to Stop Creating Dashboards
Service Level Indicators for Every Java Microservice
Errors
Latency
Garbage Collection Pause Times
Heap Utilization
CPU Utilization
File Descriptors
Suspicious Traffic
Batch Runs or Other Long-Running Tasks
Building Alerts Using Forecasting Methods
Naive Method
Single-Exponential Smoothing
Universal Scalability Law
Summary
5. Safe, Multicloud Continuous Delivery
Types of Platforms
Resource Types
Delivery Pipelines
Packaging for the Cloud
Packaging for IaaS Platforms
Packaging for Container Schedulers
The Delete + None Deployment
The Highlander
Blue/Green Deployment
Automated Canary Analysis
Spinnaker with Kayenta
General-Purpose Canary Metrics for Every Microservice
Summary
6. Source Code Observability
The Stateful Asset Inventory
Release Versioning
Maven Repositories
Build Tools for Release Versioning
Capturing Resolved Dependencies in Metadata
Capturing Method-Level Utilization of the Source Code
Structured Code Search with OpenRewrite
Dependency Management
Version Misalignments
Dynamic Version Constraints
Unused Dependencies
Undeclared Explicitly Used Dependencies
Summary
7. Traffic Management
Microservices Offer More Potential Failure Points
Concurrency of Systems
Platform Load Balancing
Gateway Load Balancing
Join the Shortest Queue
Instance-Reported Availability and Utilization
Health Checks
Choice of Two
Instance Probation
Knock-On Effects of Smarter Load Balancing
Client-Side Load Balancing
Hedge Requests
Call Resiliency Patterns
Retries
Rate Limiters
Bulkheads
Circuit Breakers
Adaptive Concurrency Limits
Choosing the Right Call Resiliency Pattern
Implementation in Service Mesh
Implementation in RSocket
Summary
Index
Anderen die dit boek kochten, kochten ook
Rubrieken
- advisering
- algemeen management
- coaching en trainen
- communicatie en media
- economie
- financieel management
- inkoop en logistiek
- internet en social media
- it-management / ict
- juridisch
- leiderschap
- marketing
- mens en maatschappij
- non-profit
- ondernemen
- organisatiekunde
- personal finance
- personeelsmanagement
- persoonlijke effectiviteit
- projectmanagement
- psychologie
- reclame en verkoop
- strategisch management
- verandermanagement
- werk en loopbaan


