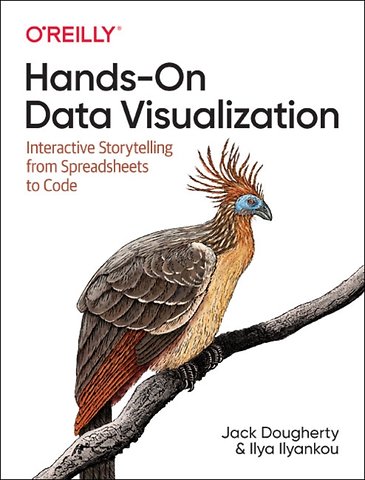
Hands–On Data Visualization
Interactive Storytelling From Spreadsheets to Code
Paperback Engels 2021 1e druk 9781492086000Samenvatting
Tell your story and show it with data, using free and easy-to-learn tools on the web. This introductory book teaches you how to design interactive charts and customized maps for your website, beginning with simple drag-and-drop tools such as Google Sheets, Datawrapper, and Tableau Public. You'll also gradually learn how to edit open source code templates like Chart.js, Highcharts, and Leaflet on GitHub.
Hands-On Data Visualization takes you step-by-step through tutorials, real-world examples, and online resources. This practical guide is ideal for students, nonprofit organizations, small business owners, local governments, journalists, academics, and anyone who wants to take data out of spreadsheets and turn it into lively interactive stories. No coding experience is required.
- Build interactive charts and maps and embed them in your website
- Understand the principles for designing effective charts and maps
- Learn key data visualization concepts to help you choose the right tools
- Convert and transform tabular and spatial data to tell your data story
- Edit and host Chart.js, Highcharts, and Leaflet map code templates on GitHub
- Learn how to detect bias in charts and maps produced by others
Specificaties
Lezersrecensies
Inhoudsopgave
Audience and Overview
Advice for Hands-On Learning
Chapter Outline
Conventions Used in This Book
O’Reilly Online Learning
How to Contact Us
Acknowledgments
Introduction
Why Data Visualization?
What Can You Believe?
Some Pictures Are More Persuasive
Different Shades of the Truth
Organization of the Book
I. Foundational Skills
1. Choose Tools to Tell Your Story
Start Sketching Your Data Story
Ten Factors When Considering Tools
1. Easy to Learn
2. Free or Affordable
3. Powerful
4. Supported
5. Portable
6. Secure and Private
7. Collaborative
8. Cross-Platform
9. Open Source
10. Accessible for Visually Impaired Readers
Our Recommended Tools
Use a Password Manager
2. Strengthen Your Spreadsheet Skills
Select Your Spreadsheet Tools
Download to CSV or ODS Format
Make a Copy of a Google Sheet
Share Your Google Sheets
Upload and Convert to Google Sheets
Geocode Addresses in Google Sheets
Collect Data with Google Forms
Sort and Filter Data
Calculate with Formulas
Summarize Data with Pivot Tables
Match Columns with VLOOKUP
Spreadsheet Versus Relational Database
3. Find and Question Your Data
Guiding Questions for Your Search
Public and Private Data
Mask or Aggregate Sensitive Data
Open Data Repositories
Source Your Data
Recognize Bad Data
Question Your Data
4. Clean Up Messy Data
Smart Cleanup with Google Sheets
Find and Replace with Blank
Transpose Rows and Columns
Split Data into Separate Columns
Example 2: Complex Splitting
Combine Data into One Column
Extract Tables from PDFs with Tabula
Clean Data with OpenRefine
Set Up OpenRefine
Load Data and Start a New Project
Convert Dollar Amounts from Text to Numbers
Cluster Similar Spellings
5. Make Meaningful Comparisons
Precisely Describe Comparisons
Normalize Your Data
Beware of Biased Comparisons
II. Building Visualizations
6. Chart Your Data
Chart Design Principles
Deconstruct a Chart
Some Rules Are More Important Than Others
Chart Aesthetics
Google Sheets Charts
Bar and Column Charts
Grouped Bar and Column Charts
Split Bar and Column Charts
Stacked Bar and Column Charts
Histograms
Quick Histograms with Google Sheets Column Stats
Regular Histograms with Google Sheets Charts
Pie, Line, and Area Charts
Pie Charts
Line Charts
Stacked Area Charts
Datawrapper Charts
Annotated Charts
Range Charts
Scatter and Bubble Charts
Scatter Charts with Google Sheets
Bubble Charts
Tableau Public Charts
Scatter Charts with Tableau Public
Install Tableau Public and Connect Data
Create Scatter Chart in the Worksheet
Add Title and Caption, and Publish
Filtered Line Chart
Connect Data to Tableau Public
Build and Publish a Filtered Line Chart
7. Map Your Data
Map Design Principles
Deconstructing a Map
Clarify Point-Versus-Polygon Data
Map One Variable, Not Two
Choose Smaller Geographies for Choropleth Maps
Design Choropleth Colors and Intervals
Choose Choropleth Palettes to Match Your Data
Choose Color Intervals to Group Choropleth Map Data
Normalize Choropleth Map Data
Point Map with Google My Maps
Symbol Point Map with Datawrapper
Choropleth Map with Datawrapper
Choropleth Map with Tableau Public
Current Map with Socrata Open Data
8. Table Your Data
Table Design Principles
Datawrapper Table with Sparklines
Other Table-Making Tools
9. Embed on the Web
Static Image Versus Interactive iframe
Get the Embed Code or iframe Tag
From Google Sheets
From Datawrapper
From Tableau Public
Paste Code or iframe to a Website
To WordPress.com Sites
To Self-Hosted WordPress Sites
For Squarespace, Wix, Weebly, or Other Web-Building Sites
III. Code Templates and Advanced Tools
10. Edit and Host Code with GitHub
Copy, Edit, and Host a Simple Leaflet Map Template
Convert GitHub Pages Link to iframe
Create a New Repo and Upload Files on GitHub
GitHub Desktop and Atom Text Editor to Code Efficiently
11. Chart.js and Highcharts Templates
Bar or Column Chart with Chart.js
Error Bars with Chart.js
Line Chart with Chart.js
Annotated Line Chart with Highcharts
Scatter Chart with Chart.js
Bubble Chart with Chart.js
12. Leaflet Map Templates
Leaflet Maps with Google Sheets
Tutorial Requirements and Overview
Leaflet Storymaps with Google Sheets
Tutorial Requirements and Overview
Get Your Google Sheets API Key
Leaflet Maps with CSV Data
Leaflet Heatmap Points with CSV Data
Leaflet Searchable Point Map
Step 1: Prepare Your Data
Step 2: Download and Edit This Template
Step 3: Publish Your Map
Leaflet Maps with Open Data APIs
13. Transform Your Map Data
Geospatial Data and GeoJSON
GeoJSON
Shapefiles
GPS Exchange Format
Keyhole Markup Language
MapInfo TAB
Find GeoJSON Boundary Files
Draw and Edit with GeoJson.io
Convert KML, GPX, and Other Formats into GeoJSON
Create GeoJSON from a CSV File
Create New GeoJSON Data with Drawing Tools
Edit and Join with Mapshaper
Import, Convert, and Export Map Boundary Files
Edit Data for Specific Polygons
Rename Data Fields
Remove Unwanted Data Fields
Simplify Map Boundaries to Reduce File Size
Dissolve Internal Polygons to Create an Outline Map
Clip a Map to Match an Outline Layer
Join Spreadsheet Data With Polygon Map
Count Points in Polygons with Mapshaper
More About Joins
Merge Selected Polygons with Join and Dissolve Commands
Convert Compressed KMZ to KML
Georeference with Map Warper
Bulk Geocode with US Census
Pivot Points into Polygon Data
IV. Telling True, Meaningful Stories
14. Detect Lies and Reduce Bias
How to Lie with Charts
Exaggerate Change in Charts
Diminish Change in Charts
How to Lie with Maps
Examine Data and Upload to Datawrapper
Modify the Map Color Ranges
Recognize and Reduce Data Bias
Recognize and Reduce Spatial Bias
15. Tell and Show Your Data Story
Build a Narrative on a Storyboard
Draw Attention to Meaning
Acknowledge Sources and Uncertainty
Decide on Your Data Story Format
A. Fix Common Problems
Tool or Platform Problems
Try a Different Browser
Diagnose with Developer Tools
Mac or Chromebook Problems
Watch Out for Bad Data
Common iframe Errors
Fix Your Code on GitHub
Index


Rubrieken
- advisering
- algemeen management
- coaching en trainen
- communicatie en media
- economie
- financieel management
- inkoop en logistiek
- internet en social media
- it-management / ict
- juridisch
- leiderschap
- marketing
- mens en maatschappij
- non-profit
- ondernemen
- organisatiekunde
- personal finance
- personeelsmanagement
- persoonlijke effectiviteit
- projectmanagement
- psychologie
- reclame en verkoop
- strategisch management
- verandermanagement
- werk en loopbaan