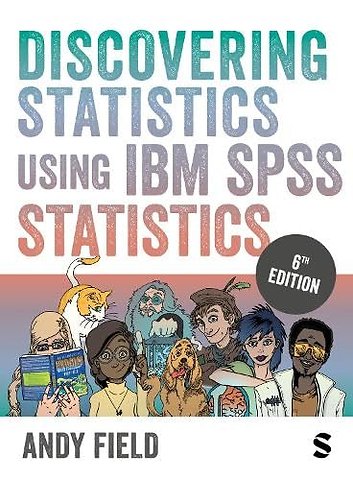
Discovering Statistics Using IBM SPSS Statistics
Paperback Engels 2024 6e druk 9781529630008Samenvatting
With its unique combination of humour and step-by-step instruction, this award-winning book is the statistics lifesaver for everyone. From initial theory through to regression, factor analysis and multilevel modelling, Andy Field animates statistics and SPSS software with his famously bizarre examples and activities.
Features:
• Flexible coverage to support students across disciplines and degree programmes
• Can support classroom or lab learning and assessment
• Analysis of real data with opportunities to practice statistical skills
• Highlights common misconceptions and errors
• A revamped online resource that uses video, case studies, datasets, testbanks and more to help students negotiate project work, master data management techniques, and apply key writing and employability skills
• Covers the range of versions of IBM SPSS Statistics©.
All the online resources above (video, case studies, datasets, testbanks) can be easily integrated into your institution's virtual learning environment or learning management system. This allows you to customize and curate content for use in module preparation, delivery and assessment.
Specificaties
Lezersrecensies
Inhoudsopgave
What the hell am I doing here? I don’t belong here
The research process
Initial observation: finding something that needs explaining
Generating and testing theories and hypotheses
Collecting data: measurement
Collecting data: research design
Reporting Data
Chapter 2: The SPINE of statistics
What is the SPINE of statistics?
Statistical models
Populations and Samples
P is for parameters
E is for Estimating parameters
S is for standard error
I is for (confidence) Interval
N is for Null hypothesis significance testing, NHST
Reporting significance tests
Chapter 3: The phoenix of statistics
Problems with NHST
NHST as part of wider problems with science
A phoenix from the EMBERS
Sense, and how to use it
Preregistering research and open science
Effect sizes
Bayesian approaches
Reporting effect sizes and Bayes factors
Chapter 4: The IBM SPSS Statistics environment
Versions of IBM SPSS Statistics
Windows, MacOS and Linux
Getting started
The Data Editor
Entering data into IBM SPSS Statistics
Importing Data
The SPSS Viewer
Exporting SPSS Output
The Syntax Editor
Saving files
Opening files
Extending IBM SPSS Statistics
Chapter 5: Data Visualisation
The art of presenting data
The SPSS Chart Builder
Histograms
Boxplots (box-whisker diagrams)
Graphing means: bar charts and error bars
Line charts
Graphing relationships: the scatterplot
Editing graphs
Chapter 6: The beast of bias
What is bias?
Outliers
Overview of assumptions
Additivity and Linearity
Normally distributed something or other
Independence
Spotting outliers
Spotting normality
Spotting linearity and heteroscedasticity/heterogeneity of variance
Reducing Bias
Chapter 7: Non-parametric models
When to use non-parametric tests
General procedure of non-parametric tests in SPSS
Comparing two independent conditions: the Wilcoxon rank-sum test and Mann– Whitney test
Comparing two related conditions: the Wilcoxon signed-rank test
Differences between several independent groups: the Kruskal–Wallis test
Differences between several related groups: Friedman’s ANOVA
Chapter 8: Correlation
Modelling relationships
Data entry for correlation analysis
Bivariate correlation
Partial and semi-partial correlation
Comparing correlations
Calculating the effect size
How to report correlation coefficents
Chapter 9: The Linear Model (Regression)
An Introduction to the linear model (regression)
Bias in linear models?
Generalizing the model
Sample size in regression
Fitting linear models: the general procedure
Using SPSS Statistics to fit a linear model with one predictor
Interpreting a linear model with one predictor
The linear model with two of more predictors (multiple regression)
Using SPSS Statistics to fit a linear model with several predictors
Interpreting a linear model with several predictors
Robust regression
Bayesian regression
Reporting linear models
Chapter 10: Comparing two means
Looking at differences
An example: are invisible people mischievous?
Categorical predictors in the linear model
The t-test
Assumptions of the t-test
Comparing two means: general procedure
Comparing two independent means using SPSS Statistics
Comparing two related means using SPSS Statistics
Reporting comparisons between two means
Between groups or repeated measures?
Chapter 11: Moderation and Mediation
The PROCESS tool
Moderation: Interactions in the linear model
Mediation
Categorical predictors in regression
Chapter 12: GLM 1: Comparing several independent means
Using a linear model to compare several means
Assumptions when comparing means
Planned contrasts (contrast coding)
Post hoc procedures
Comparing several means using SPSS Statistics
Output from one-way independent ANOVA
Robust comparisons of several means
Bayesian comparison of several means
Calculating the effect size
Reporting results from one-way independent ANOVA
Chapter 13: GLM 2: Comparing means adjusted for other predictors (analysis of covariance)
What is ANCOVA?
ANCOVA and the general linear model
Assumptions and issues in ANCOVA
Conducting ANCOVA using SPSS Statistics
Interpreting ANCOVA
Testing the assumption of homogeneity of regression slopes
Robust ANCOVA
Bayesian analysis with covariates
Calculating the effect size
Reporting results
Chapter 14: GLM 3: Factorial designs
Factorial designs
Independent factorial designs and the linear model
Model assumptions in factorial designs
Factorial designs using SPSS Statistics
Output from factorial designs
Interpreting interaction graphs
Robust models of factorial designs
Bayesian models of factorial designs
Calculating effect sizes
Reporting the results of two-way ANOVA
Chapter 15: GLM 4: Repeated-measures designs
Introduction to repeated-measures designs
A grubby example
Repeated-measures and the linear model
The ANOVA approach to repeated-measures designs
The F-statistic for repeated-measures designs
Assumptions in repeated-measures designs
One-way repeated-measures designs using SPSS
Output for one-way repeated-measures designs
Robust tests of one-way repeated-measures designs
Effect sizes for one-way repeated-measures designs
Reporting one-way repeated-measures designs
A boozy example: a factorial repeated-measures design
Factorial repeated-measures designs using SPSS Statistics
Interpreting factorial repeated-measures designs
Effect Sizes for factorial repeated-measures designs
Reporting the results from factorial repeated-measures designs
Chapter 16: GLM 5: Mixed designs
Mixed designs
Assumptions in mixed designs
A speed dating example
Mixed designs using SPSS Statistics
Output for mixed factorial designs
Calculating effect sizes
Reporting the results of mixed designs
Chapter 17: Multivariate analysis of variance (MANOVA)
Introducing MANOVA
Introducing matrices
The theory behind MANOVA
MANOVA using SPSS Statistics
Interpreting MANOVA
Reporting results from MANOVA
Following up MANOVA with discriminant analysis
Interpreting discriminant analysis
Reporting results from discriminant analysis
The final interpretation
Chapter 18: Exploratory factor analysis
When to use factor analysis
Factors and Components
Discovering factors
An anxious example
Factor analysis using SPSS statistics
Interpreting factor analysis
Interpreting factor analysis
Reliability analysis
Reliability analysis using SPSS Statistics
Interpreting Reliability analysis
How to report reliability analysis
Chapter 19: Categorical outcomes: chi-square and loglinear analysis
Analysing categorical data
Associations between two categorical variables
Associations between several categorical variables: loglinear analysis
Assumptions when analysing categorical data
General procedure for analysing categorical outcomes
Doing chi-square using SPSS Statistics
Interpreting the chi-square test
Loglinear analysis using SPSS Statistics
Interpreting loglinear analysis
Reporting the results of loglinear analysis
Chapter 20: Categorical outcomes: logistic regression
What is logistic regression?
Theory of logistic regression
Sources of bias and common problems
Binary logistic regression
Interpreting logistic regression
Reporting logistic regression
Testing assumptions: another example
Predicting several categories: multinomial logistic regression
Chapter 21: Multilevel linear models
Hierarchical data
Theory of multilevel linear models
The multilevel model
Some practical issues
Multilevel modelling using SPSS Statistics
Growth models
How to report a multilevel model
A message from the octopus of inescapable despair
Chapter 22: Epilogue
Vaak samen gekocht

- Discovering Statistics Using IBM SPSS Statistics · Andy Field € 62,00
- Research Methods in Accounting · Smith € 62,00
Anderen kochten ook
 Connie de Boer€ 58,50
 William Scott€ 246,29
 Julie Pallant€ 50,95
 Andy Field€ 63,–
 Manfred te Grotenhuis€ 61,72
 Johan Smits€ 44,50
Rubrieken
- advisering
- algemeen management
- coaching en trainen
- communicatie en media
- economie
- financieel management
- inkoop en logistiek
- internet en social media
- it-management / ict
- juridisch
- leiderschap
- marketing
- mens en maatschappij
- non-profit
- ondernemen
- organisatiekunde
- personal finance
- personeelsmanagement
- persoonlijke effectiviteit
- projectmanagement
- psychologie
- reclame en verkoop
- strategisch management
- verandermanagement
- werk en loopbaan